Analyzing Results
So you’ve uploaded your data and now you want to know what it means and how you can best use it for change at your institution.
First, you may be interested in your complexity score.
It's important to note that while complexity does not indicate quality or rigor, which we'll show below, but it is still an important piece of the puzzle.
- Provide curriculum committees with analytical tools that can be used to predict the impact of curricular redesigns.
- Ability to more formally compare/contrast how different schools solve similar curricular challenges: curricular design patterns.
- Ability to analyze the entire curricular inventory of a college or university: common curricular patterns, meta-majors, important courses, complexity outliers?
- Ability to compare and contrast the curricula across a discipline, and to relate curricular measures to other factors, e.g., complexity vs. quality, curricular equity.
- Compare a program’s curricula to the programs at peer institutions.
- Relate a program’s curriculum to other programmatic issues, e.g., change of major, success rates, etc.
- By comparing to similar curricula at other schools, we can better estimate a priori resource requirements, e.g., # new courses, # new faculty, # of students in classes, etc.
- Being used to inform creation a new Software Engineering program at UArizona.
- Evaluate the efficiency of transfer articulation curricula: is complexity equally balanced across institutions, is it really a 2+2 program?
- Ongoing work to provide a statewide transfer articulation system (Kentucky Council on Postsecondary Education).
- Create degree plans that take into account: prior coursework, toxic course combinations, major/minor combinations, etc.
- Particularly beneficial for advisors, and might be useful in projecting course demand.
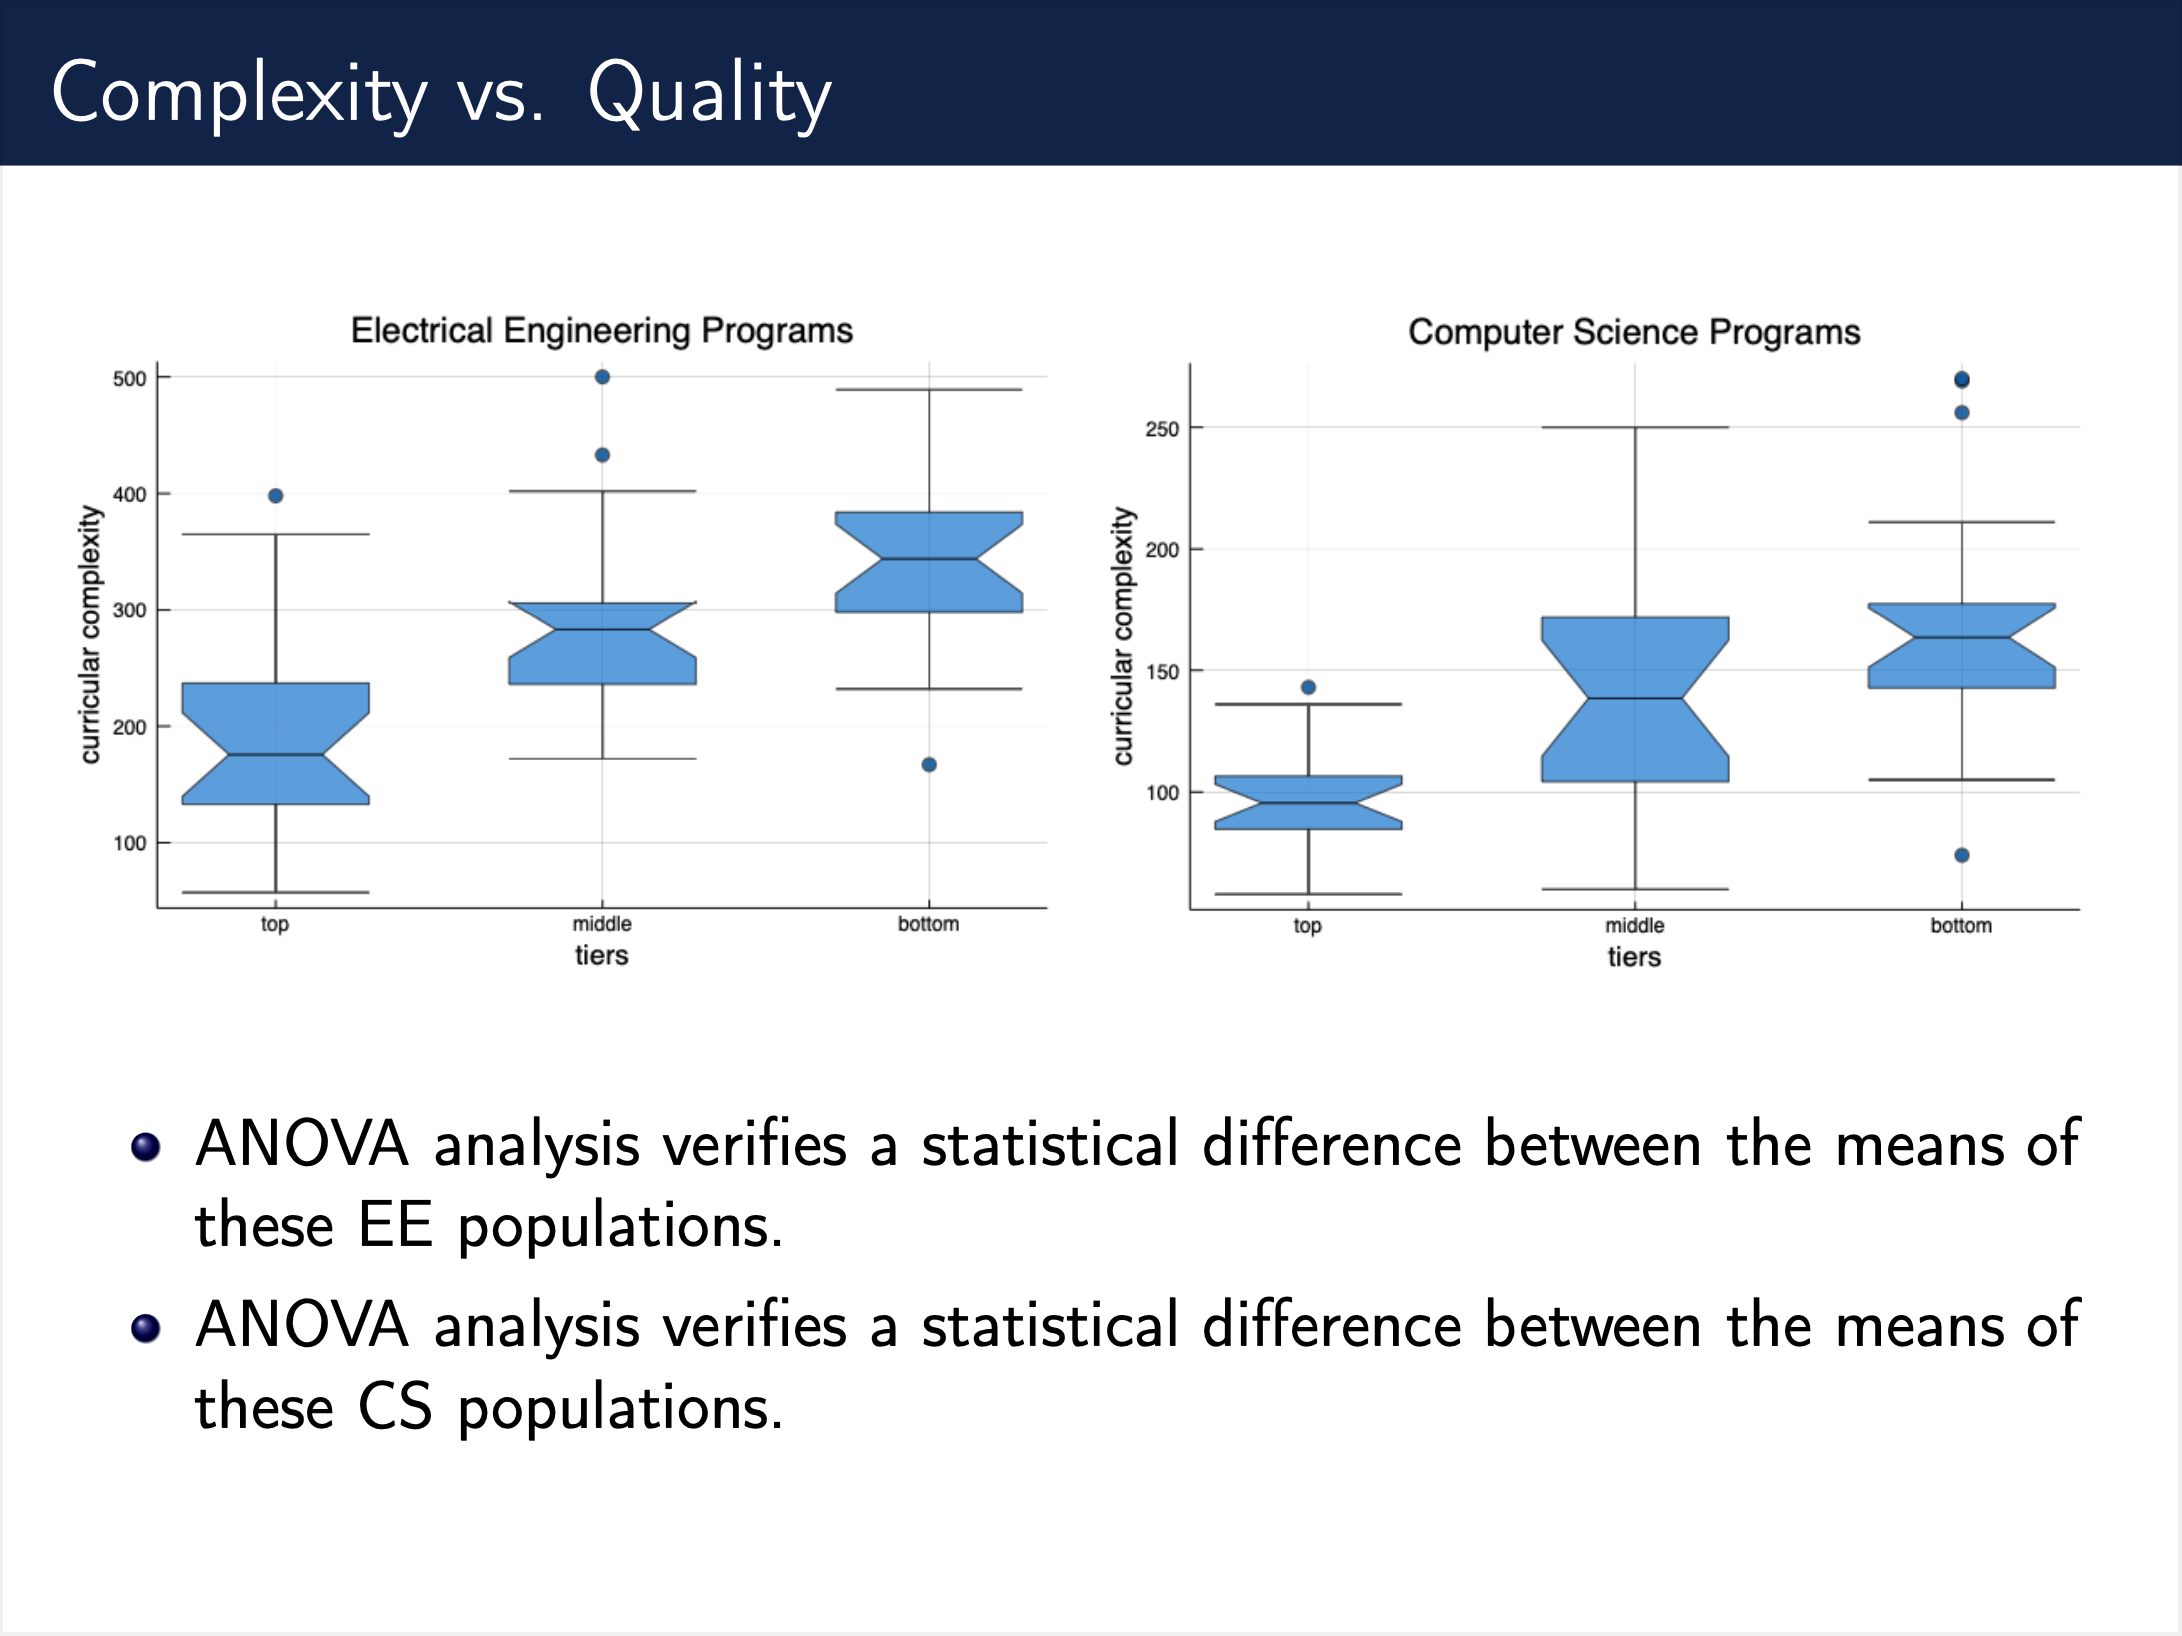
- Do higher quality programs have higher curricular complexity?
- Let's consider undergraduate electrical engineering programs at doctoral institutions.
- Let U.S. News & World Report rankings serve as a proxy for quality.
The following diagram shows us that the top tier schools had lower complexity ranges than middle and bottom tier schools in the programs of Electrical Engineering and Computer Science.
Tiers were constructed by grouping the top two deciles, middle two deciles, and bottom two deciles from the list of rankings.
The full details of this study can be found in our paper published in ASEE.
Therefore, we know that higher quality programs have lower curricular complexity relative to other programs in the same discipline.
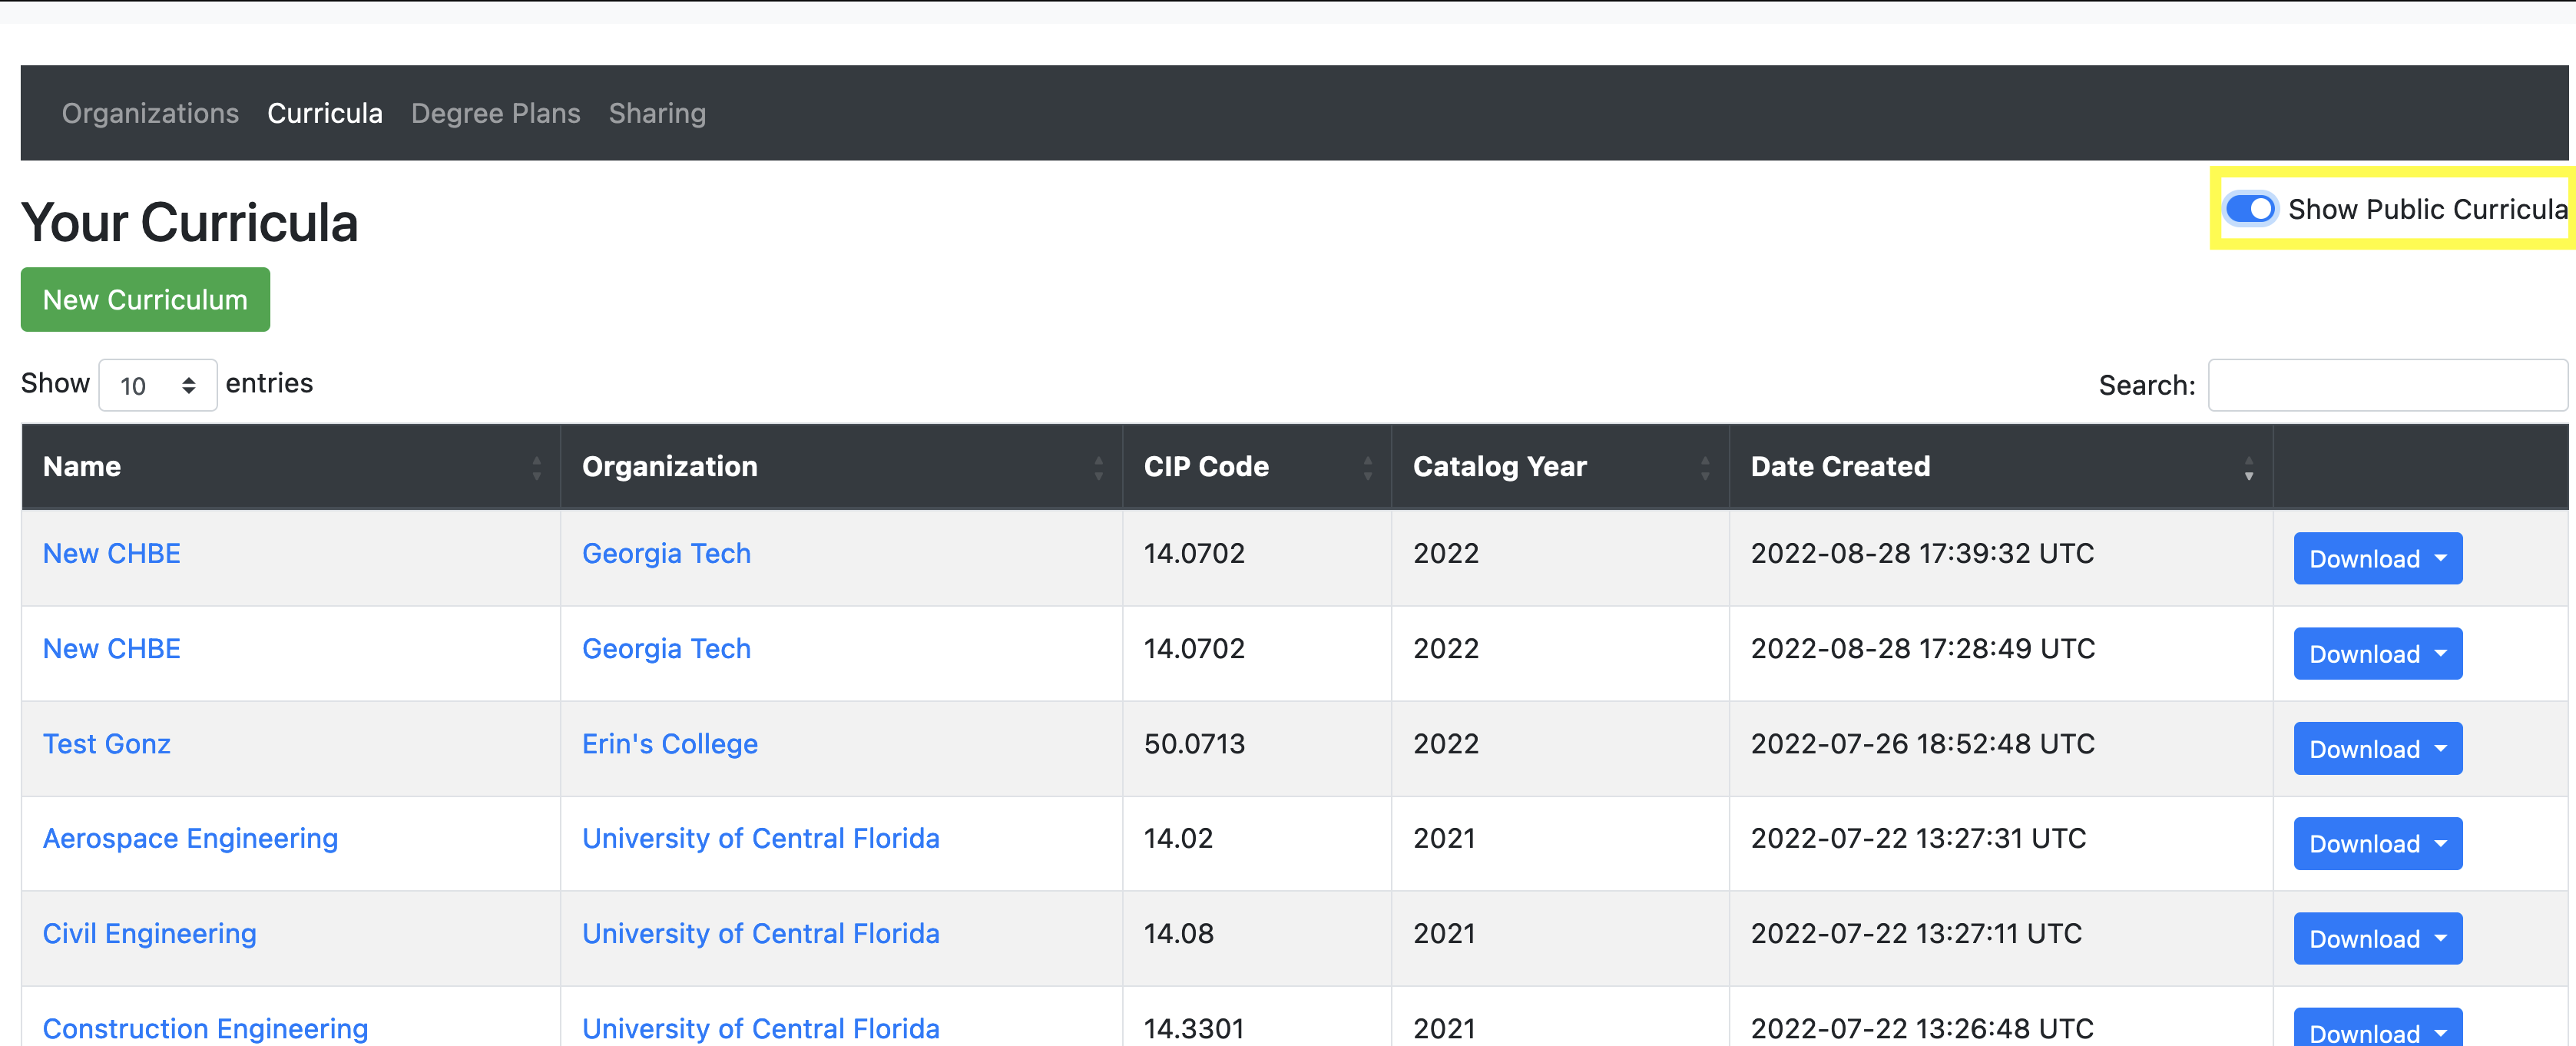
One of the best ways to look at complexity is by comparing the complexity of one program to the complexity of similar programs.
To that end, you can toggle the curriculums table to include public institution’s data to compare to your own curricula. You can see this in the diagram below.
Rather than looking at the just the complexity number, we recommend that you additionally review the following:
- long chains of prerequisites 6-7+
- few free electives
- delay of general education requirements into later terms
- bottleneck courses
- these courses have a high centrality measure
- lots of prerequisites and a prerequisite for many other courses
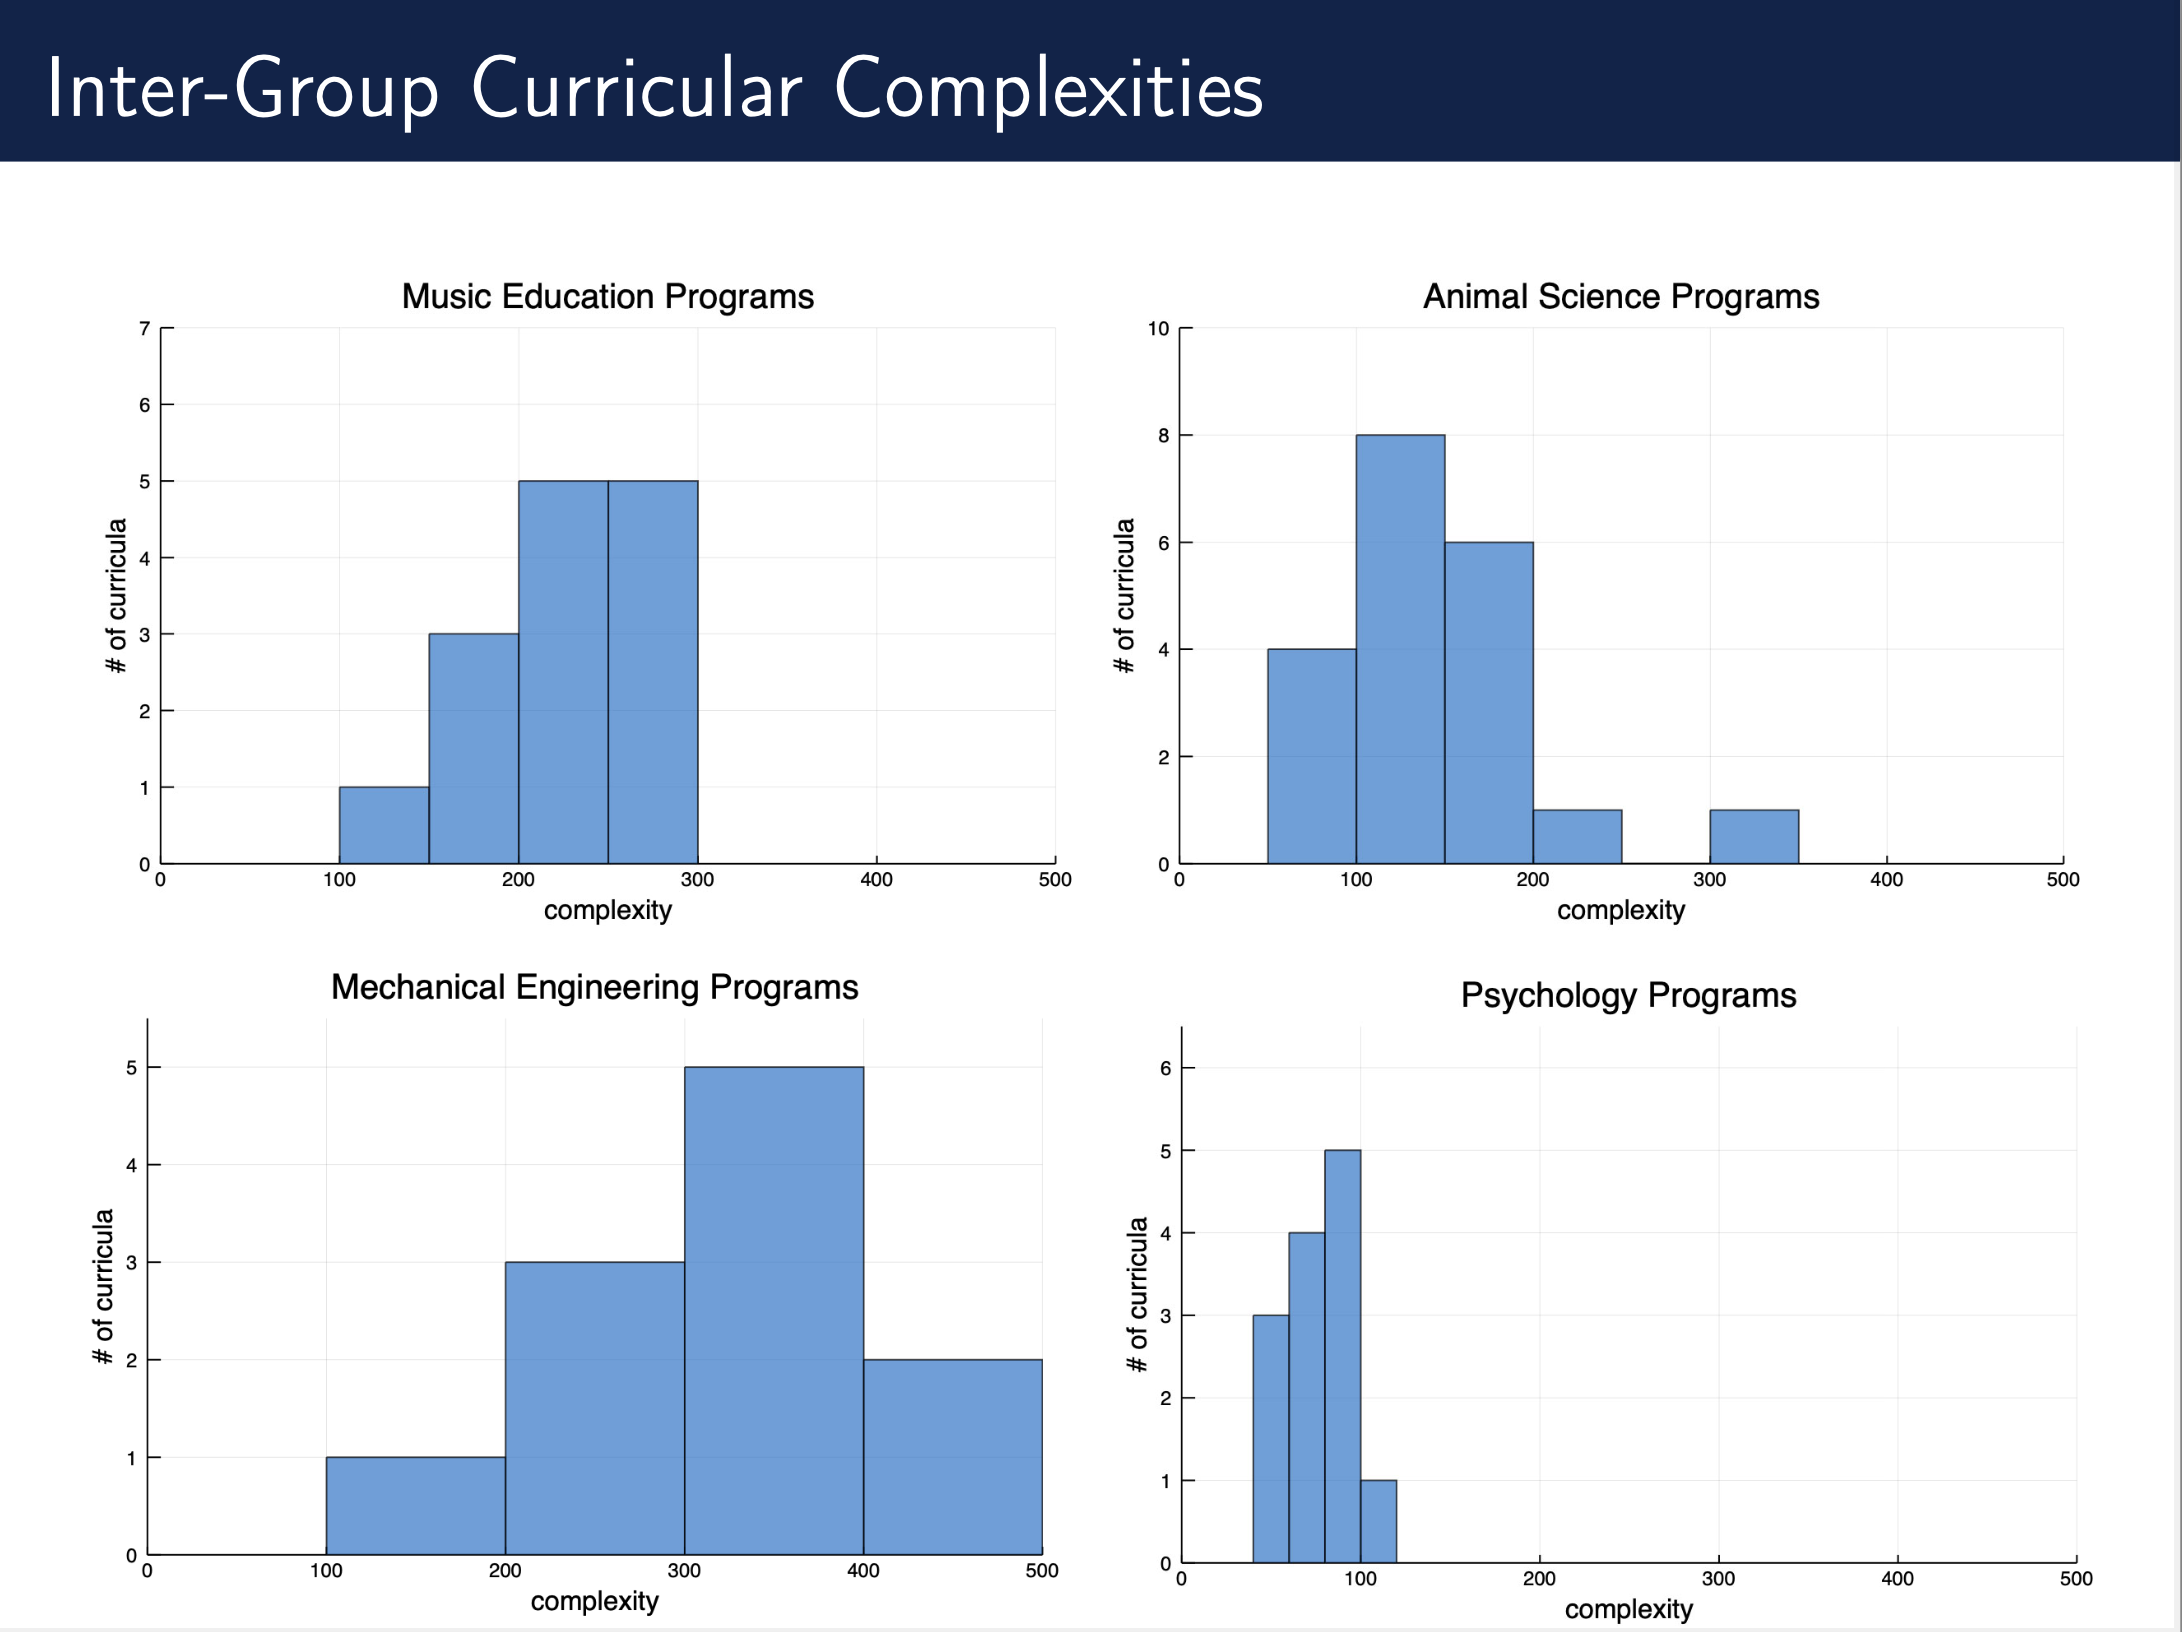
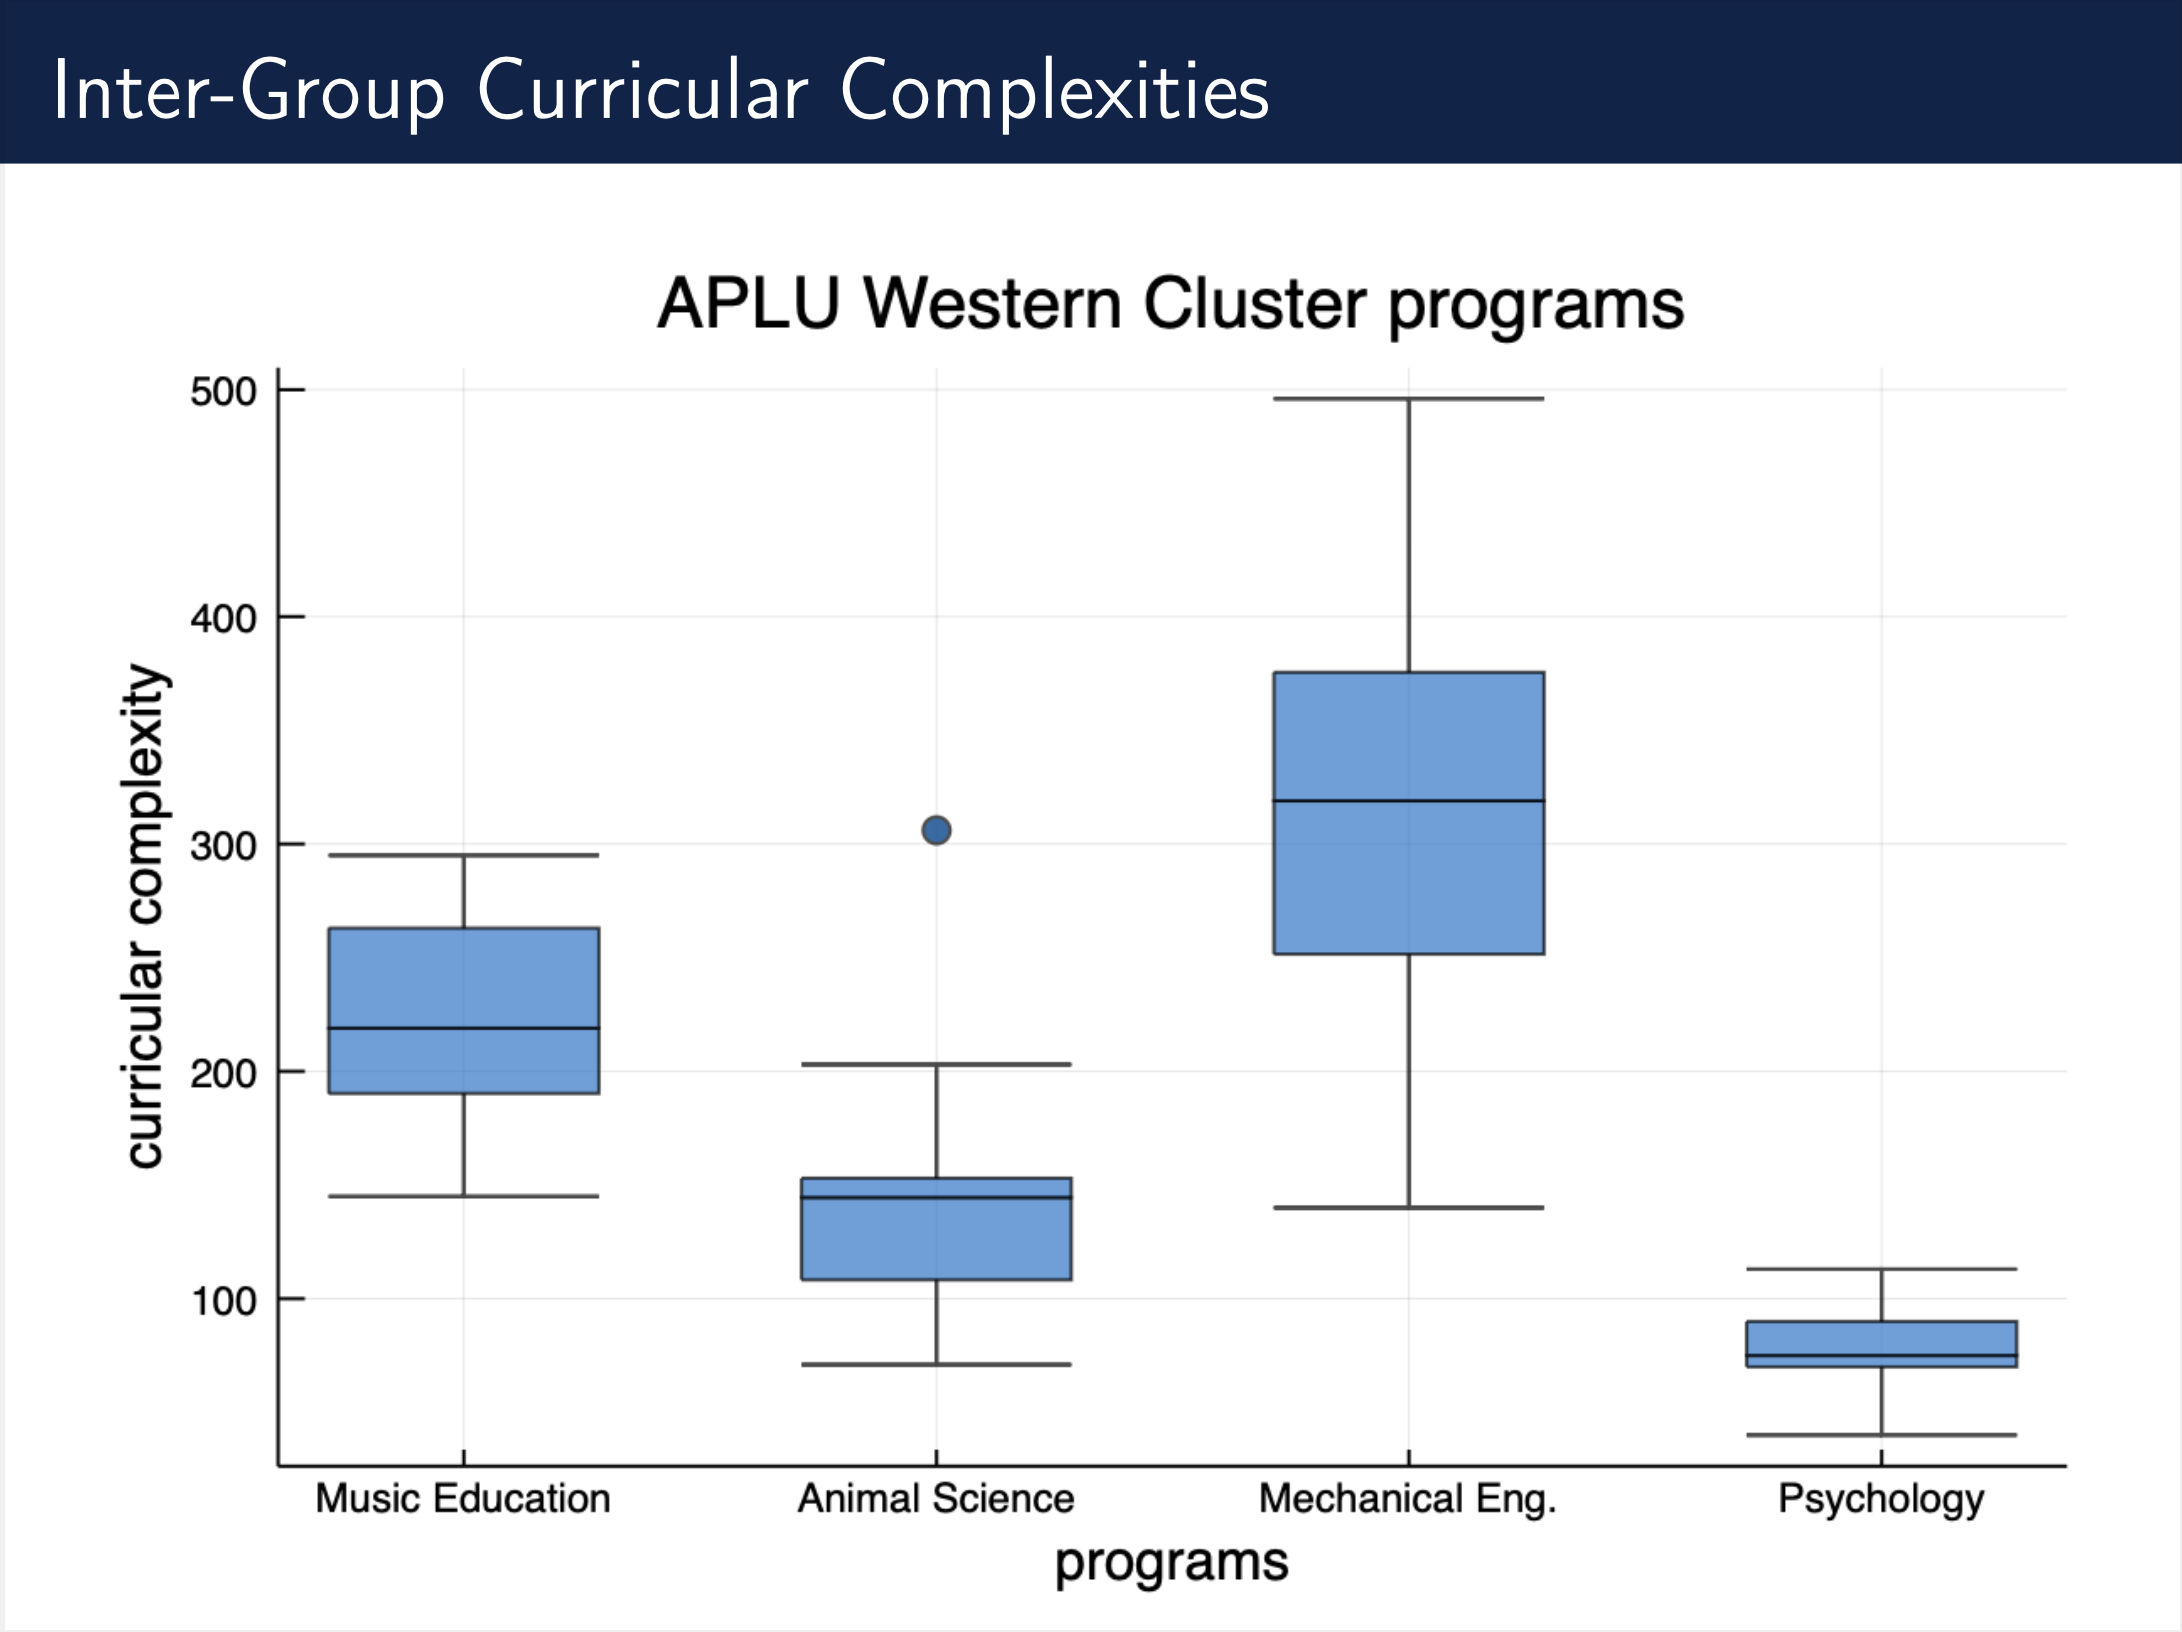
See the below diagrams for an example of the complexity ranges for the different disciplines.